A picture is worth a thousand words. The truth of this age old idiom is once again proved in the business context through Data Visualization.
Computerization has helped businesses in automating transactions and generating reports of these transactions for managerial use, and almost all small and medium businesses today have adopted computerization in one way or another to run their operations. They could be using Microsoft Excel, packages like Tally, customized software or even ERP’s.
Most software has provision for generating operational reports, but generating interactive dashboards has been the preserve of large companies with huge IT budgets. It is only over the last couple of years that it has become possible for small and medium businesses to harvest the data gathered through the software and use it for generating what is known as Business Intelligence through Data Visualization – without having to spend huge amounts of money.
Simply put, Data Visualization:
- Provides information in new and more constructive ways
- Helps Visualize relationships and patterns between operational and business activities
- Helps identify and act on emerging trends
- Allows users to manipulate and interact directly with data
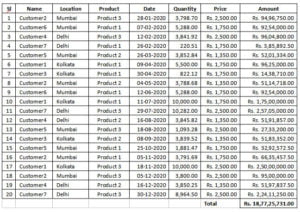
The best way to understand how Data Visualization works is through an example. Consider the sales register of a hypothetical company:
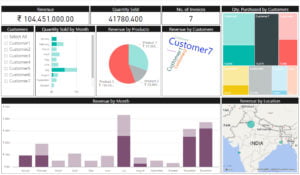
Now, let’s look at the same data visualized as a simple dashboard using a Business Intelligence tool:
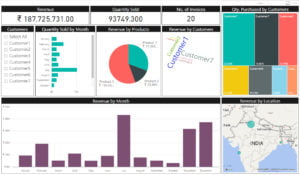
We can see immediately from this dashboard that Customers 1, 7 and 2 generate the maximum amount of revenue. Similarly, from the three products in the company portfolio, Product 3 earns the most revenue. We can also see that maximum revenue comes from Delhi while July, November and December are the best months for sales.
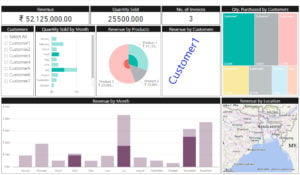
Now, let’s interact with the dashboard and click on Customer 1 in the Word Cloud:
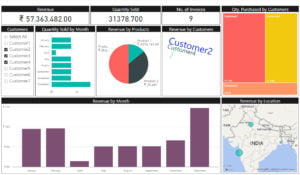
Similarly, we can also select a group of customers (2, 3 and 4) to see their details:
Instead of customers, we can also select a Product (3) to see who buys it, from where and when:
We can thus see how data from even a simple tabular report, when converted into an interactive visualization, can help management quickly and easily assimilate the underlying information, and thereby take informed decisions.
Visualization also helps view the data from newer perspectives and allows even inexperienced users to get insights that were once the exclusive preserve of older and more experienced colleagues. More importantly, it gives decision makers the ability to slice and dice the data i.e. to break a body of information down into smaller parts or to examine it from different viewpoints so that one can understand it better.
In today’s data driven world, the availability of economical data visualization solutions need to be taken advantage of by MSMEs in order to survive and grow in the face of competition from corporate behemoths.


