There is considerable concern that India’s population will surpass that of China in the next decade or so. With climate change being an imminent threat to the population, this must be avoided at all cost.
China seems to have done so much better in controlling its population. In comparison, India always appears to be lagging. But before we get further upset and consider the various options that seem to be easy solutions, it is necessary to look at some of the facts around population in India that are not well publicised.
Some of the solutions that have been discussed include imposing a strict restriction on the number of children a couple can have or punishing them for having a third child by withholding free education or healthcare. We already we have some limitations on election to panchayats for persons with more than two children in many states. The idea of extending this to MPs and MLAs also seems an attractive option.
In some states, people with more than two children are not given government jobs and promotions are denied. But before we discuss the merits of different measures to limit the population, it will be useful to understand some facts and figures behind the population situation in India today.
- Why is India’s population still growing while China’s has halted?

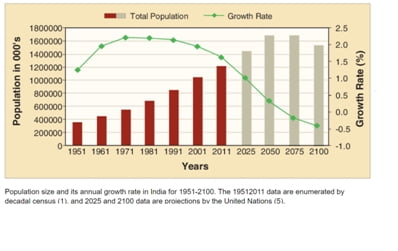
China’s population growth has NOT halted. Both India and China have growing populations. The rate of growth is different. India has a population growth rate of 1% per year while China has a population growth rate of 0.6% per year.
According to current projections, China’s population will stop growing and start declining by around 2030. For India, this will come a little later in 2065. To provide some global perspective, the US continues to grow at 0.7% while Japan has a contracting population at -0.2%. If you look at the population growth rate across the world since 2010, Australia has the highest growth rate and by the turn of this century, when India will have a negative growth rate, the US will have a higher growth rate than ours (See -Figure 1).
2. Why is there ‘Population Explosion’ in India?
There is no ‘Population Explosion’ in India. Increase in the number of people is influenced by four factors – births, deaths, in-migration and out-migration. The number of people grew in the 60s, 70s and 80s because the survival rate started becoming much higher as the death rate came down drastically, but the birth rate did not, and the population grew. Later, the birth rate also started coming down and the population growth rate has been coming down every year (See Figure 2).
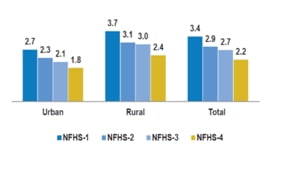
But birth rates are more difficult to contain because there are two factors involved, the first being the number of children each woman has in her lifetime (called the Total Fertility Rate) and the number of women who are in the reproducing age group at any point in time. What has happened in India in the last 50 years is that the number of children per couple, has come down rapidly from six to about two (See Figure 3).
In some states, it is now less than two children per couple. But the number of women of reproducing age is now much larger compared to earlier (the children who were born earlier are now in the reproducing age group) leading to the apparently large number of children being born. This is clearly visible when one looks at the ‘population pyramid’, which gives the break-up of population by age group.
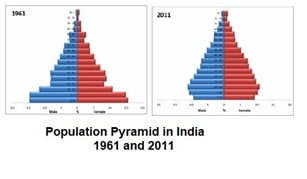
If we compare the population pyramid of India from 1951 to 2011, we can clearly see that the proportion of children in the population has come down while the number of younger people has become much higher (See Figure 4).
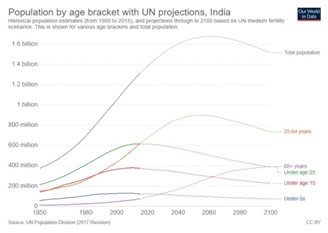
The delay in the reduction in the number of children per couple and the overall slowing of the population growth rate is called the ‘momentum effect’ much like the fact that a car or train continues to move for some time after the brake has been applied. The distance it will cover depends on the speed at which it was travelling. The speed of population growth was fast (as death rates came down fast) because of successful public health measures and what we see is the momentum from those times. If we look at the figures, the population ‘growth rate’ is coming down every year. Only the population of those above 25 years of age is still growing. The population growth rate of all younger age groups is coming down. (See Figure 5).
3. What is the situation regarding population growth in Odisha?
Odisha is one state that has been very successfully able to reduce its population growth rate in recent times. The Total Fertility Rate (TFR) or the number of children a woman has in her life is already 2.1 for the entire state, which means Odisha has been able to reach replacement fertility. The TFR in urban Odisha is 1.7. The decline in fertility from 1992-93 to 2015- 16 is shown in the figure. There has been a remarkable decline of 27.5% in fertility in two decades. 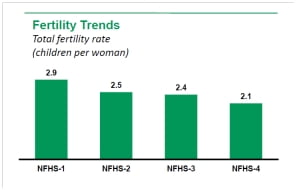
The main issue of concern in Odisha is the differential between population groups. Odisha has a high rural population and also a large tribal population. The table shows how different indicators of health-related service delivery and of health indicators differ according to different population groups. It is interesting to note that the ratio of difference between the highest-lowest for each set of indicators show that service- related indicators are less diverse compared to health-related ones. This means, that for the more marginalised social groups, even when the services are reaching them, the desired result is not being achieved. The reason for this has to be investigated and addressed locally.
| Population Group | Modern Contraceptive use | TFR | 4 + ANC | All basic vaccines | IMR | Population Proportion |
| Odisha | 45.5 | 2.05 | 64.1 | 78.6 | 40.1 | 100 |
| SC Pop | 49 | 2.13 | 63.5 | 76.8 | 37 | 20.2 |
| ST Pop | 40.6 | 2.46 | 59.9 | 74.4 | 51.8 | 23.4 |
| Rural | 44.8 | 2.12 | 63.1 | 79.2 | 43.3 | 82.4 |
| No Schooling | 48.4 | 2.66 | 55.8 | 71.7 | 57.9 | 28 |
| Urban | 48.3 | 1.73 | 69.6 | 75 | 20.9 | 17.6 |
| Ratio H:L | 1.21 | 1.54 | 1.25 | 1.10 | 2.77 |
(All data including population proportions from NFHS 4 2015 -16)
4. Is there any way to bring down the population growth rate in India?
Yes, it is possible. It requires providing appropriate contraceptives to young people. If you look at the contraceptive usage patterns currently, the most commonly used methods are the long-term Copper T Intrauterine Device (IUD) and female sterilisation. Overall, female sterilisation users are 70% of all contraceptive users and every year. This means that most couples are using contraceptives after their intended family size has been achieved (See Figure 10). The usual pattern of childbearing is marriage, first child within two years and the next within the next two years. 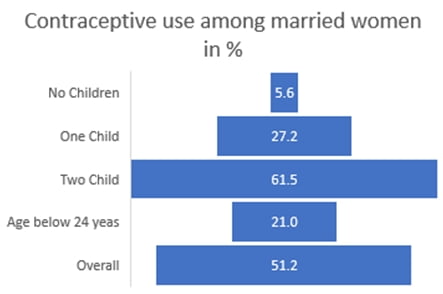
The most effective way of slowing the population growth rate is increasing this period of reproduction from 3 or 4 years to say 5 or 6 years. This simple process of delaying having children reduces the overall population growth rate considerably. For example, in a population of 1000, if there are 100 couples having 4 children each then the total number of children will be 400. Over time, a population of 1000 has 200 couples and when they have 2 children each, the total number of children is still 400 even though the number of children per couple will become half.
Now, assume these 400 children are born over 4 years in one situation and over 8 years in another situation. The number of children born every year (the growth rate) will come down considerably in the second situation compared to the first. This is where India’s family planning programme needs to reconsider its priorities. Most births in India are first or second order births but the contraceptive programme does not consider delaying these births important. The emphasis is on contraception after the second delivery. This must change if the population growth rate has to be reduced further.
This can be effectively done by discussing contraceptives with young people before they are married and among young couples. Young men must be included in this discussion as responsible partners, parents and citizens. This is possible and has been done.
5. Are there any problems if the population growth reduces rapidly?
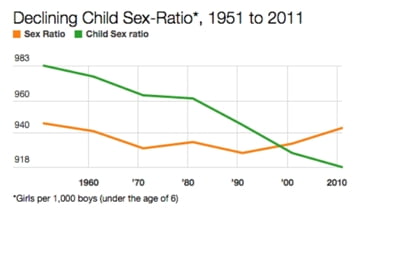
Rapid decline of the family size to below 2 children per family can lead to serious social problems. When China adopted the one child policy, it allowed couples to determine the sex of the foetus and go in for sex-selective abortions. As a consequence, the child sex ratio in China came down rapidly, which meant very few girls were being born and the number of boys in the overall population became proportionately higher. This situation of adverse sex-ratio was also found in India in states like Punjab, Haryana, Rajasthan, Gujarat and Maharashtra.
Over the last 15 years, laws concerning sex detection have become stricter but the problem continues. Family planning is about the family and gender equality is an important value within the family. Involving men as a responsible parent and partners is an important way to promote gender equality within the family and to avoid an adverse sex ratio (See Figure 11).
6. Is the declining child sex-ratio and son preference also a problem in Odisha?
The overall sex ratio showed a positive trend in Odisha between 2001 and 2011, when it rose by 7 points from 971 women for every 1000 men to 979 women. The increase was more in urban areas where it was very low in 2001 (895 to 932) compared to rural areas (987 to 989) where it continues to be much higher than in urban Odisha. However, against this gain, one needs to consider the overall decline in child sex ratio. Odisha fell from 953 girls for every 1000 boys (in 2001) to 941 girls in 2011. In urban Odisha, the figure fell from 933 to 913 showing that the trend of declining sex ratio or son preference is stronger in urban Odisha.
According to the NFHS 4 data, only 9% of women who had two boys wanted another child, but this was a much higher 38% of women among those who had two girls. On the other hand, only 11% of women with one son and daughter wanted another child, indicating a strong preference for a son among women in Odisha.
7. Are penalties like restricting benefits to couples and families useful in reducing the population growth rate?
There is no evidence to show any positive effects from such restrictions. Studies have shown that these restrictions end up penalising the most vulnerable and poor groups in the community, as these families often have more children. These families are often the farthest from all public services and need support the most. Also, women end up facing many more restrictions than men. Penalising children is a completely unjust idea as they have no role in decisions around their birth. Public services like education and healthcare (including family planning) have been shown to be very effective for reducing family size among couples.
| Population Facts in India and Odisha
India’s population growth rate has slowed down over the last two decades. India’s Population continues to increase not because couples have more children but because many more young couples are having fewer children. This is called the momentum effect. Couples from all over the country and among all social groups now have smaller families than before. Those who had larger families earlier have reduced their family sizes the most. The number of children per family which translates to the Total Fertility Rate is now 2.18 which is very close to replacement fertility of 2.1 per woman. Odisha has already achieved replacement fertility with a TFR of 2.05. The urban TFR of Odisha is 1.7 In those places where women have more children, they also have greater need for family planning services. When there are small families without gender equality in society it can lead to decline in the sex ratio of girls which is an important problem in India. There is declining child sex-ratio and overall son preference in Odisha The only way to slow population growth further is to increase the promotion and use of spacing methods Young people need access to contraceptive services. Men need to be involved in family planning as responsible partners, parents and citizens.
|


